
Federal Open Data: Transportation Fatalities
Alright, I went to the Administration’s open data portal and secured FARS data for 2016: https://catalog.data.gov/dataset/fatality-analysis-reporting-system-fars-ftp-raw-data
There’s a ton of stuff there. FARS stands for the Fatality Analysis Reporting System. It’s a census of roadway fatalities and includes a signifcant amount of identifying information including geographic coordinates.
## Loading required package: methods
OK, first calculate fatalities in any point in the metro area. First I need to reconcile geographic units because FARS uses a funky county code.
metro = read.csv("/Users/chriseshleman/Downloads/metrolist.csv", sep=",", header=F)
metro = subset(metro,V1==35620)
metro$cbsacode = as.numeric(as.character(metro$V1))
metro$V1 = NULL
metro$fipscountycode = as.numeric(as.character(metro$V3))
cross = read.csv("/Users/chriseshleman/Downloads/cbsa2fipsxw.csv")
cross = subset(cross,cross$cbsatitle=="New York-Newark-Jersey City, NY-NJ-PA")
cross$cbsacode = as.numeric(cross$cbsacode)
cross$county = str_pad(cross$fipscountycode, 3, pad = "0")
cross$fipscountycode = paste(cross$fipsstatecode,cross$county,sep="")
metro = merge(metro,cross,by="fipscountycode")
fars = merge(metro, acc, by="county",all.x=T)
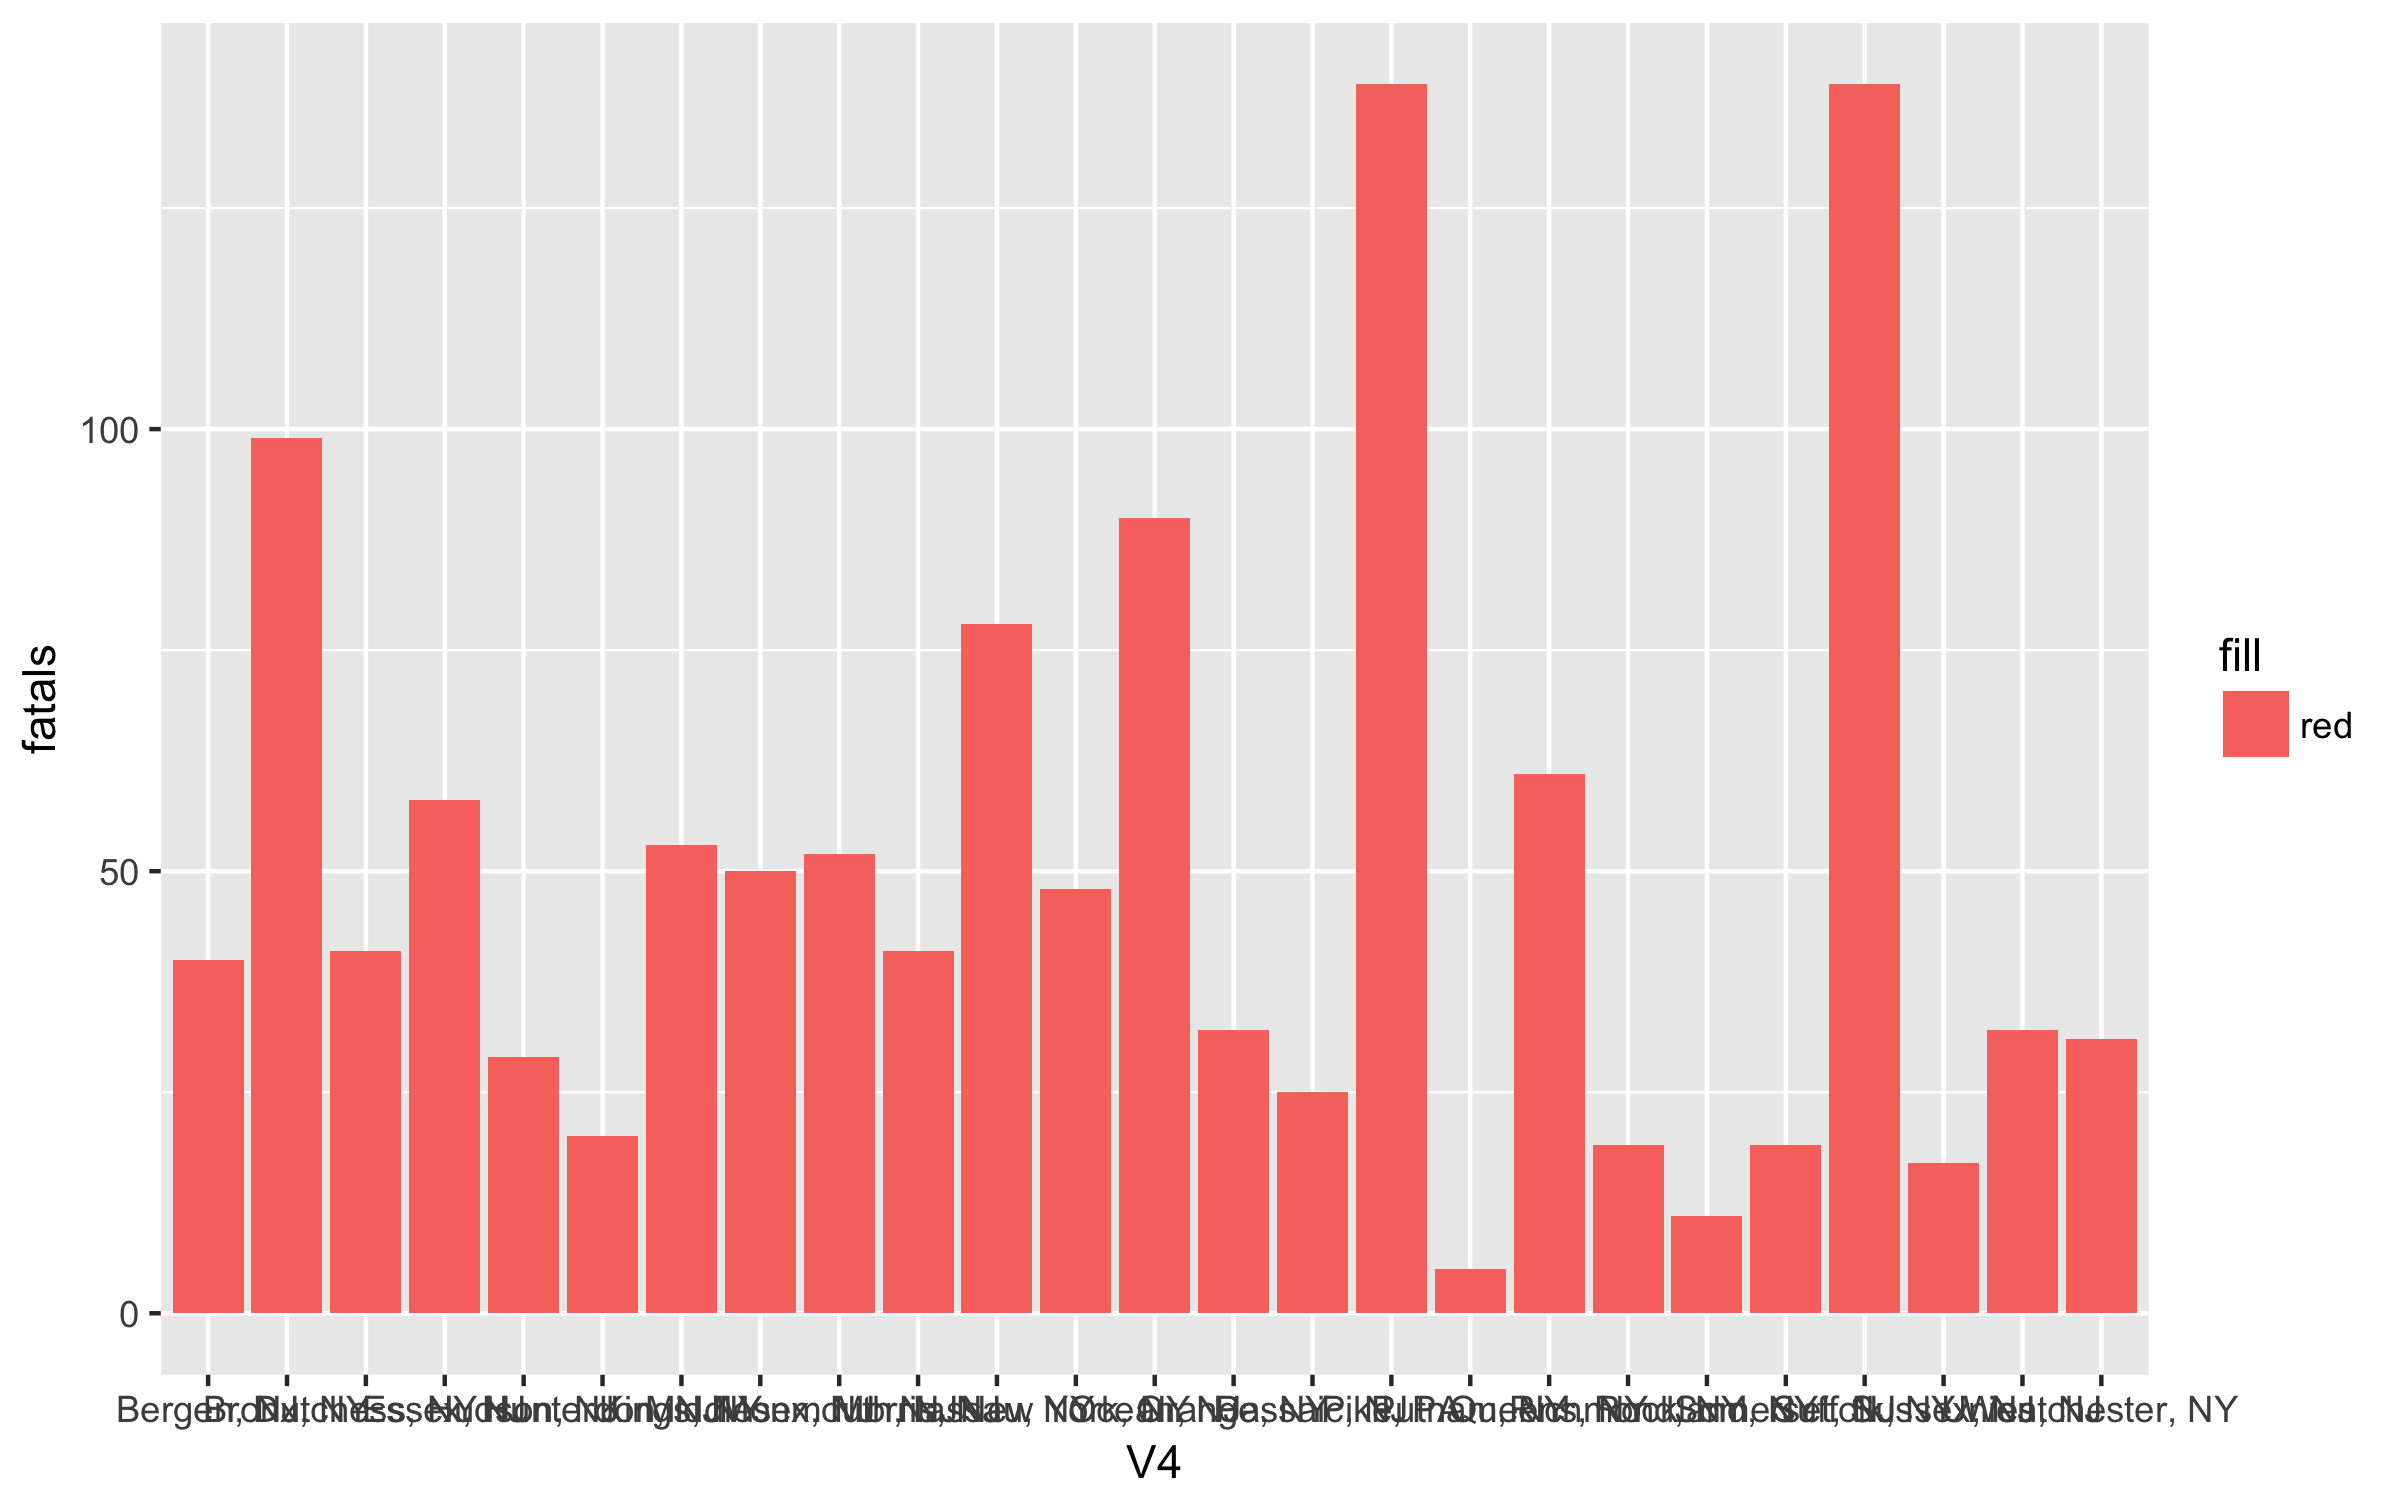
p = ggplot(fars, aes(V4, fatals)) + geom_bar(stat = "identity", aes(fill="red"))
ggsave(p,file="/Users/chriseshleman/Dropbox/pages/chriseshleman.github.io/images/Fatalities.png", width=8,height=5)
Written on January 3, 2018