
The Green Economy
Alaska and Green Jobs (Establishments)
I was talking to someone last week about the green economy. Or whatever the actual term is for the economic activity — the investments, the companies doing the work, et cetera — that protect the environment or conserve resources, at least compared to their traditional counterpart activities. I remembered seeing a flood of work there 10 years ago in things like home weatherization and alternative energy, such as geothermal. I hypothesized the slice of the state economy, however slim, representing green investment may have grown enough recently to partly or fully offset any concomitant loss in traditional investment (setting oil and gas aside), such as in mining.
It turns out that federal statisticians have already defined green jobs, which makes it easier to track the data. The Bureau of Labor Statistics states that green jobs are either:
“Jobs in businesses that produce goods or provide services that benefit the environment or conserve natural resources,” or “[j]obs in which workers’ duties involve making their establishment’s production processes more environmentally friendly or use fewer natural resources.”
It looks like BLS may still be in the process of measuring the labor side of the green economy. They’ve posted more information, referencing the survey, but I don’t see reference to a conclusion: https://www.bls.gov/green/#contact.
So for now looked at the data, leaning on the definition’s list of relevant industry codes without distinguishing further. I imported and merged every annual data set from the BLS’ employment census. Then I filtered it to include only national (aggregated) and Alaska data. That work was done elsewhere; here, I’m importing the data from my local drive.
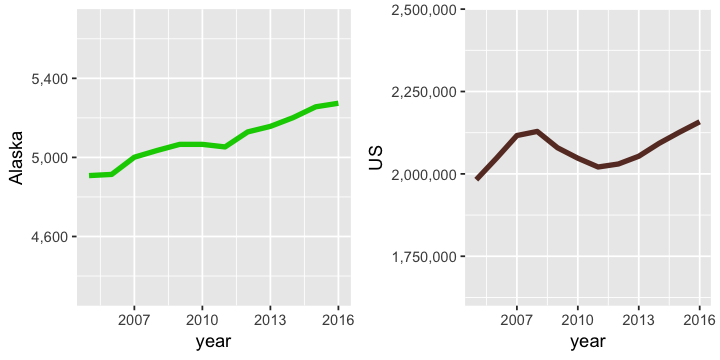
Once I’ve got it, I want to look at green jobs. So I knocked that big data set down to include only the labor subsectors identified in the BLS’ definition. Then I built a trendline tracking the number of firms represented in the definition. And I compared it to the national trend.
Firms in the BLS’ “green jobs” designation.
Very interesting. I scaled the two plots’ respective y-axes so they’re relative and comparable. Along the way I picked up a few tips for using ggplot2 from Le Hoang Van’s excellent blog.
What I see is an equal rate of increase in the number firms included in the BLS definition. Sure, this is just a first cut at understanding changes in the green economy. And sure, the US plot is shaped differently, reflecting a dip during the recession and significant growth since, while Alaska’s seems a little more recession-proof — which matches what analysts already know about the state’s economic makeup. Behind that difference is a simple fact — the green economy, as measured here by a count of establishments, is way up from 10 years ago, both for the Last Frontier and for the nation as a whole.
It’s a 8.9 percent increase for the US and 7.5 percent for Alaska from 2005-2016.
pp1 = ggplot(a, aes(year, (est_ak))) + geom_line(colour = "green3", size = 1.5) +
  scale_y_continuous(name = "Alaska",expand = c(0, 0),labels = comma, limits = c(4250,5750))
pp2 = ggplot(a, aes(year, (est_us))) + geom_line(colour = "#68382C", size = 1.5) +
  scale_y_continuous(name = "US",expand = c(0, 0),labels = comma, limits = c(1600000,2500000))
grid.arrange(pp1, pp2, ncol=2)
What are these firms doing? That’s for a separate post — the BLS data lets us dig into changes by category (construction, for example, and professional services). For now, it’s worth taking a moment just to soak up the change from a 30,000 foot level.